Profiler
PlayCanvas provides an real-time profiler to assist in diagnosing performance problems.
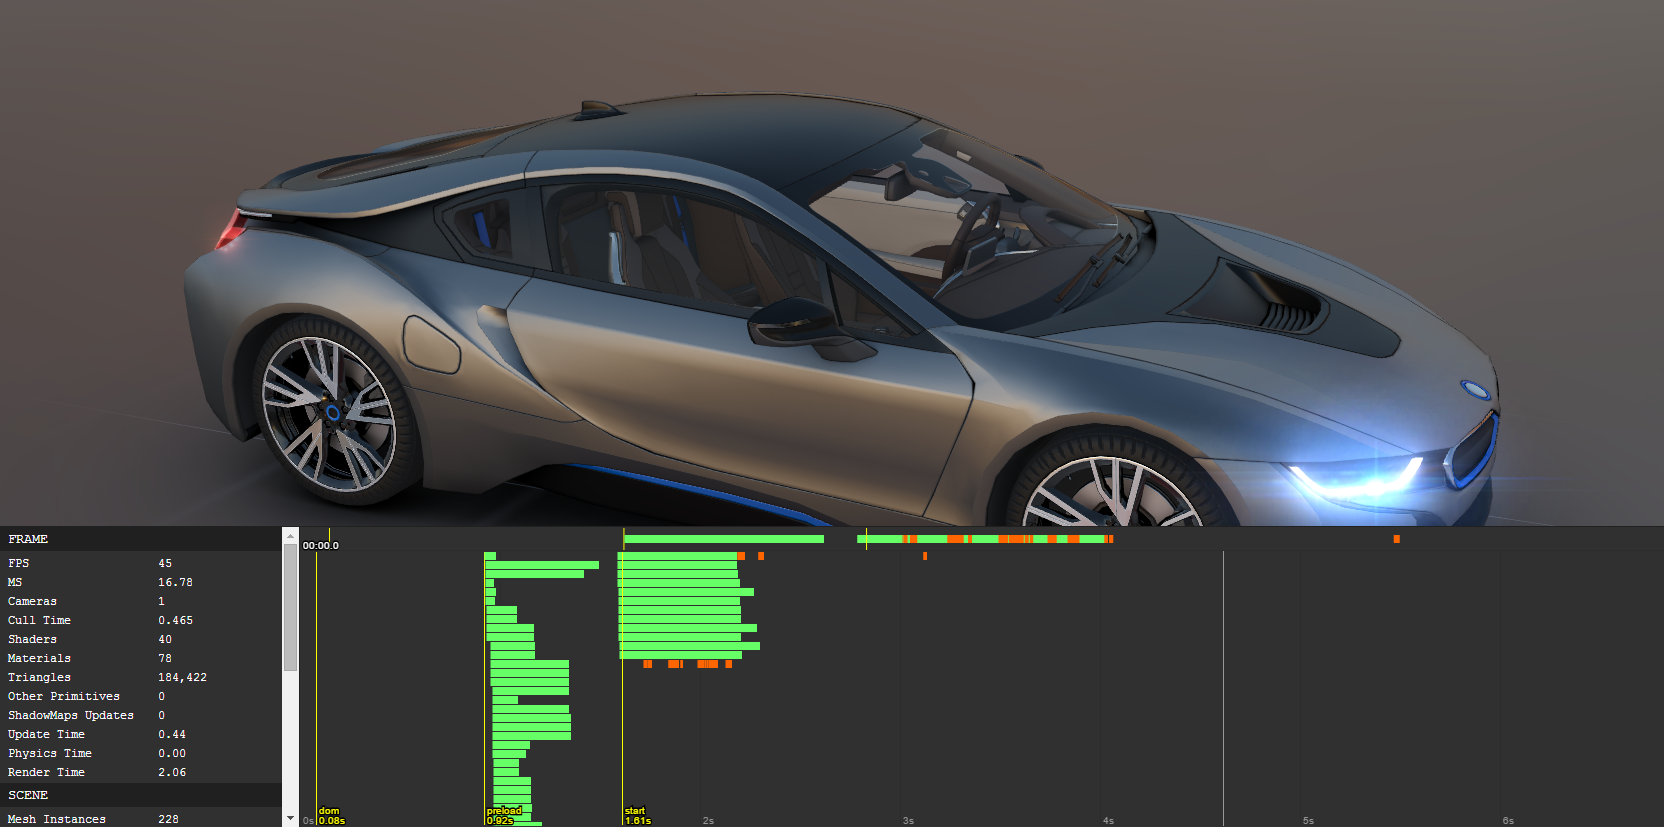
The Profiler is a panel that overlays your app, displaying lots of useful timing information and performance stats. So whenever you’re wondering why your app isn’t hitting 60 frames per second, simply launch the Profiler and you should be able to figure out exactly what the problem is.
To launch the Profiler, tick the Profiler checkbox from the sub-menu of the Launch button:
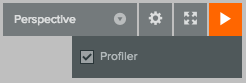
There is also a hot-key to toggle the Profiler: CTRL (CMD) + ALT + T.
Profiler Overview
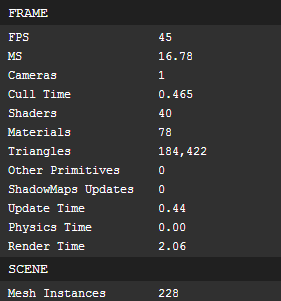
The left-hand panel of the Profiler displays statistics related to the currently rendered scene. It displays frame rate, the number of cameras enabled (you will normally want this to be 1), the number of shaders, materials, triangles and so on. Also, frame time is broken down into update (the time to run all component updates), physics (simulation time) and render time (the time to pass all of the graphics commands to WebGL). At a glance, you can quickly see where there might be problems.
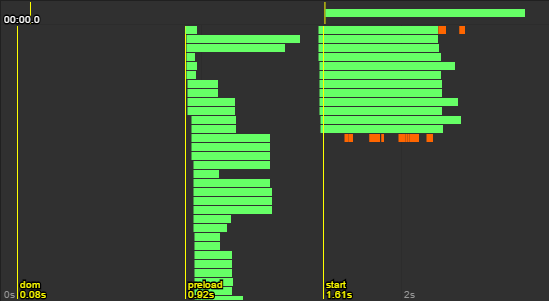
The right-hand panel is the Profiler Timeline. It displays a number of key events in your app’s life from launch:
- dom (DOM interactive): event when the browser finishes parsing html document, and is able to render first frame of a page to a screen.
- preload: event when PlayCanvas initiates preloading of all assets that are required before the app can start.
- start: event when PlayCanvas begins the main application loop and rendering begins.
Green bars represent individual asynchronous asset loads. Orange bars are blocking shader compilations.