Graph View
Overview
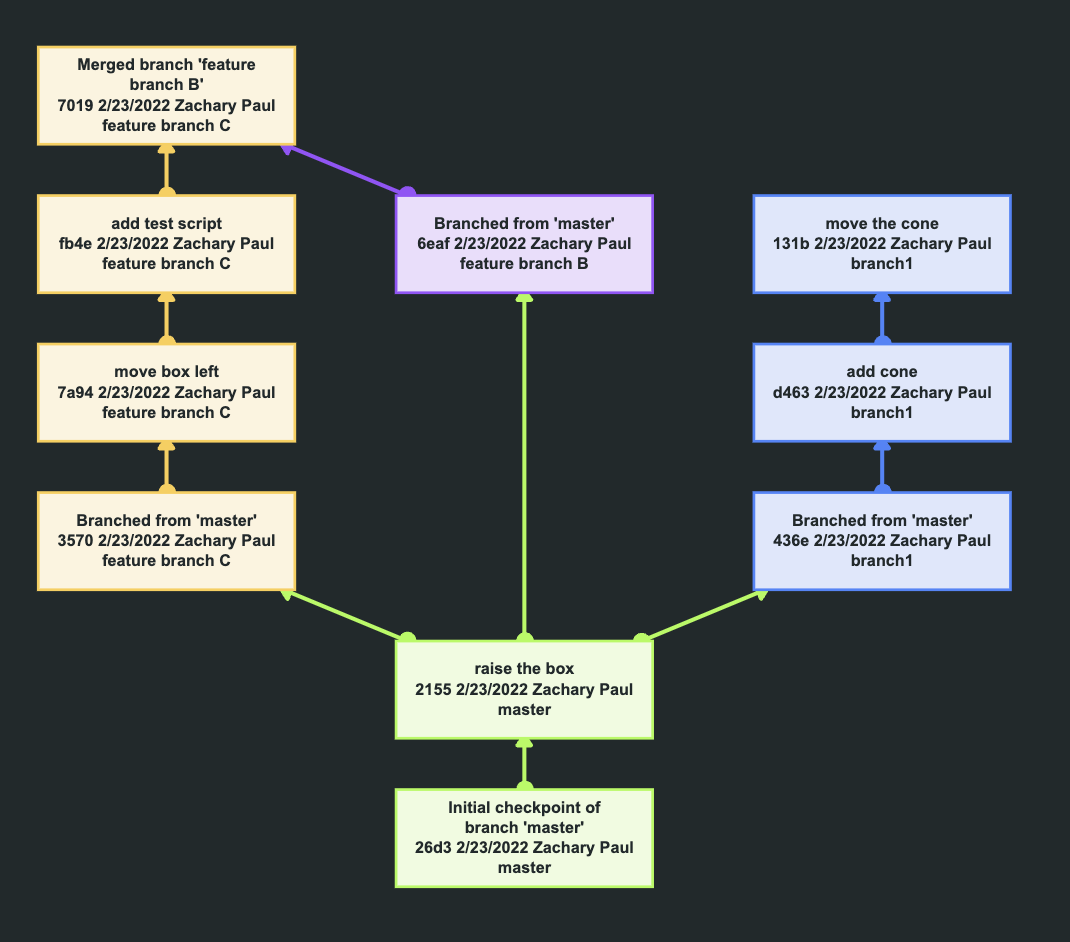
The Version Control Graph makes it easy to track progress and merge history of the branches of a PlayCanvas project.
While the Version Control Panel displays a simple list of the latest checkpoints of the selected branch, the Graph View shows a much larger (and expandable) view of the entire version control graph, including checkpoints, branches and merges:
Launching the Graph View
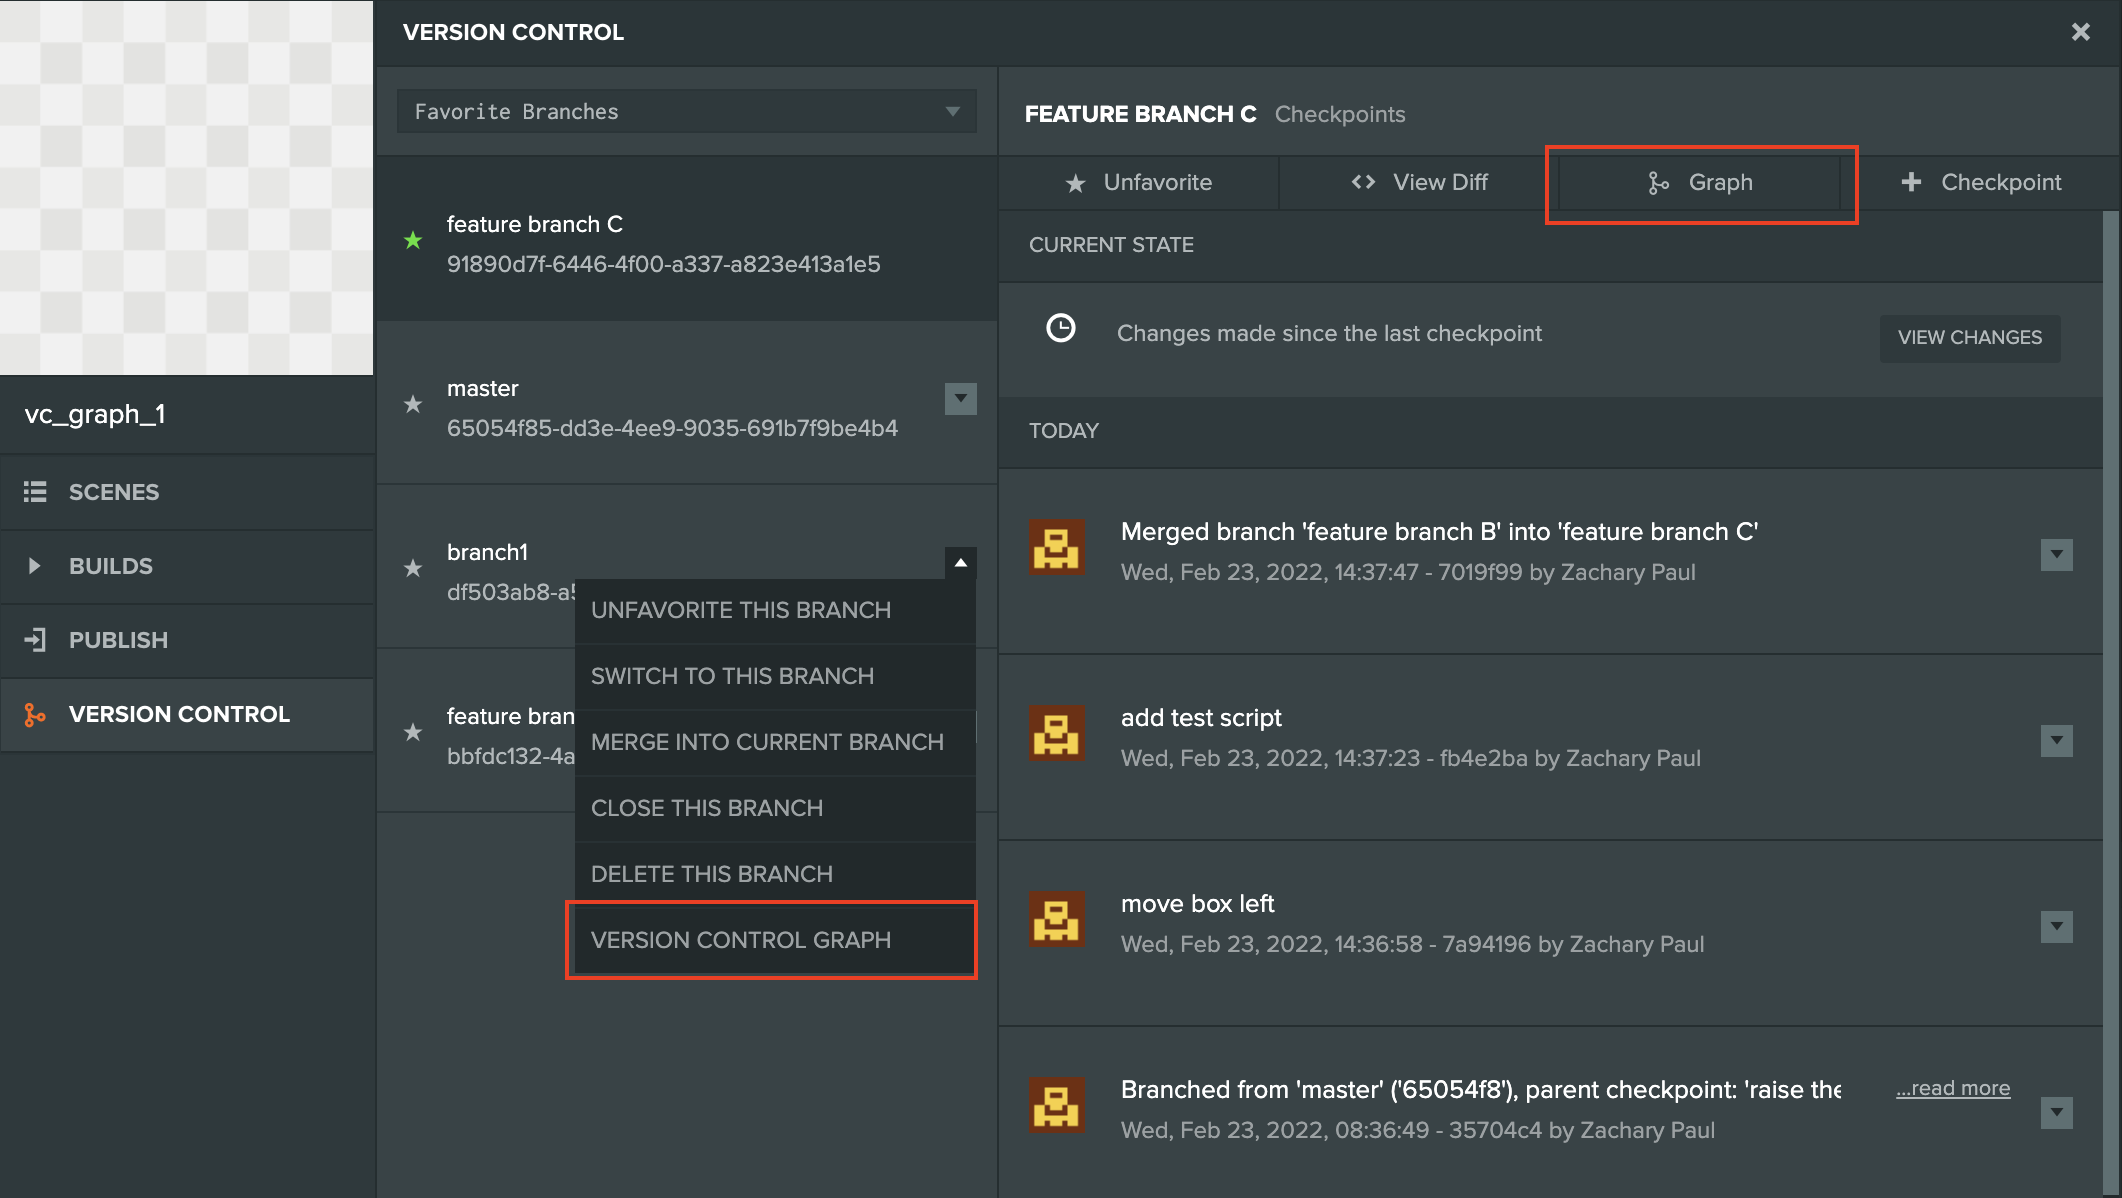
To access the Graph View, either click the Graph button in the top menu of the Version Control panel (for the current Editor branch), or the 'Version Control Graph' entry in the branch menu dropdown.
Graph Nodes
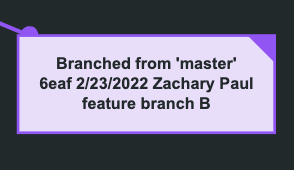
A graph node will contain the following information:
- The first (up to) two lines contain a (truncated) description of the checkpoint.
- The next line consists of the first four characters of the checkpoint GUID, its date and the name of the user who created it.
- The last line contains the name of the branch.
Graph Node Context Menu

Clicking on a node will open up the context menu for some or all following options depending on the node and access permissions:
-
View Changes - Launch a Diff View between this checkpoint and its immediate predecessor. (More details)
-
Select for Compare - Select the first checkpoint of a pair to be compared.
-
Compare with Selected - Launch a Diff View between the current node and a node marked via 'Select for Compare'.
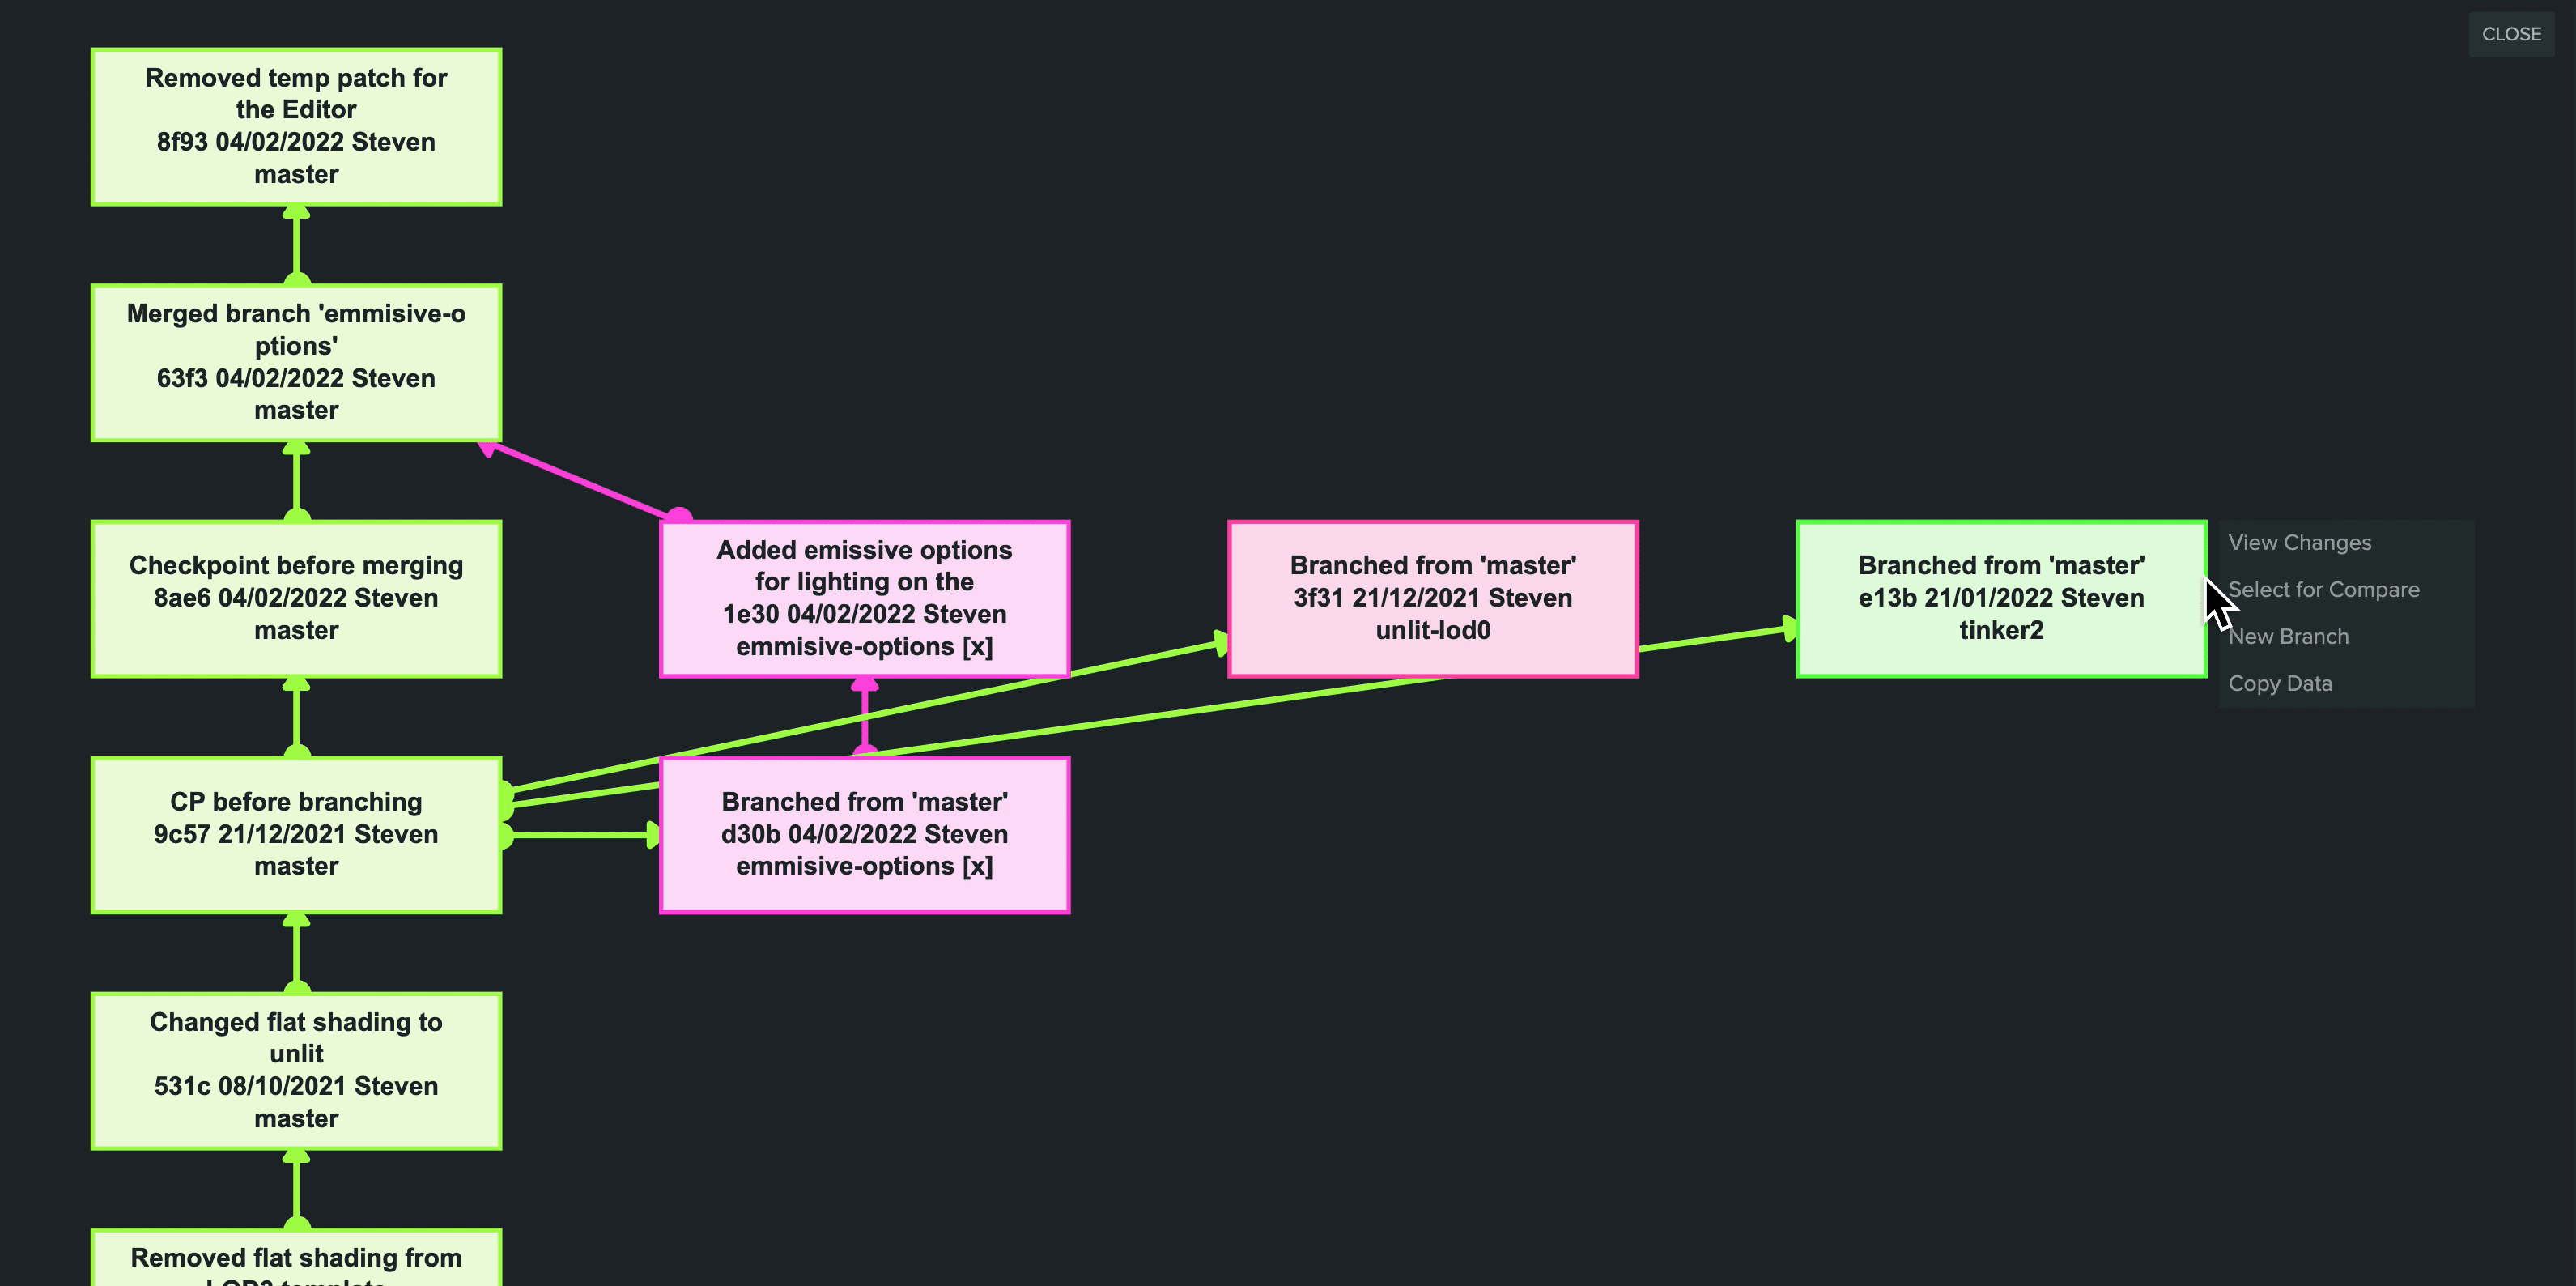
-
New Branch - Create a new branch from the selected checkpoint. (More details)
-
Copy Data - Copies full (non-truncated) checkpoint data in JSON format to the clipboard such as the checkpoint GUID, the branch id, checkpoint message etc.
-
Restore (only available for the current Editor branch) - Restore the branch state to that of the selected checkpoint. (More details)
-
Hard Reset (only available for the current Editor branch) - Perform a Hard Reset to the selected checkpoint. (More details)
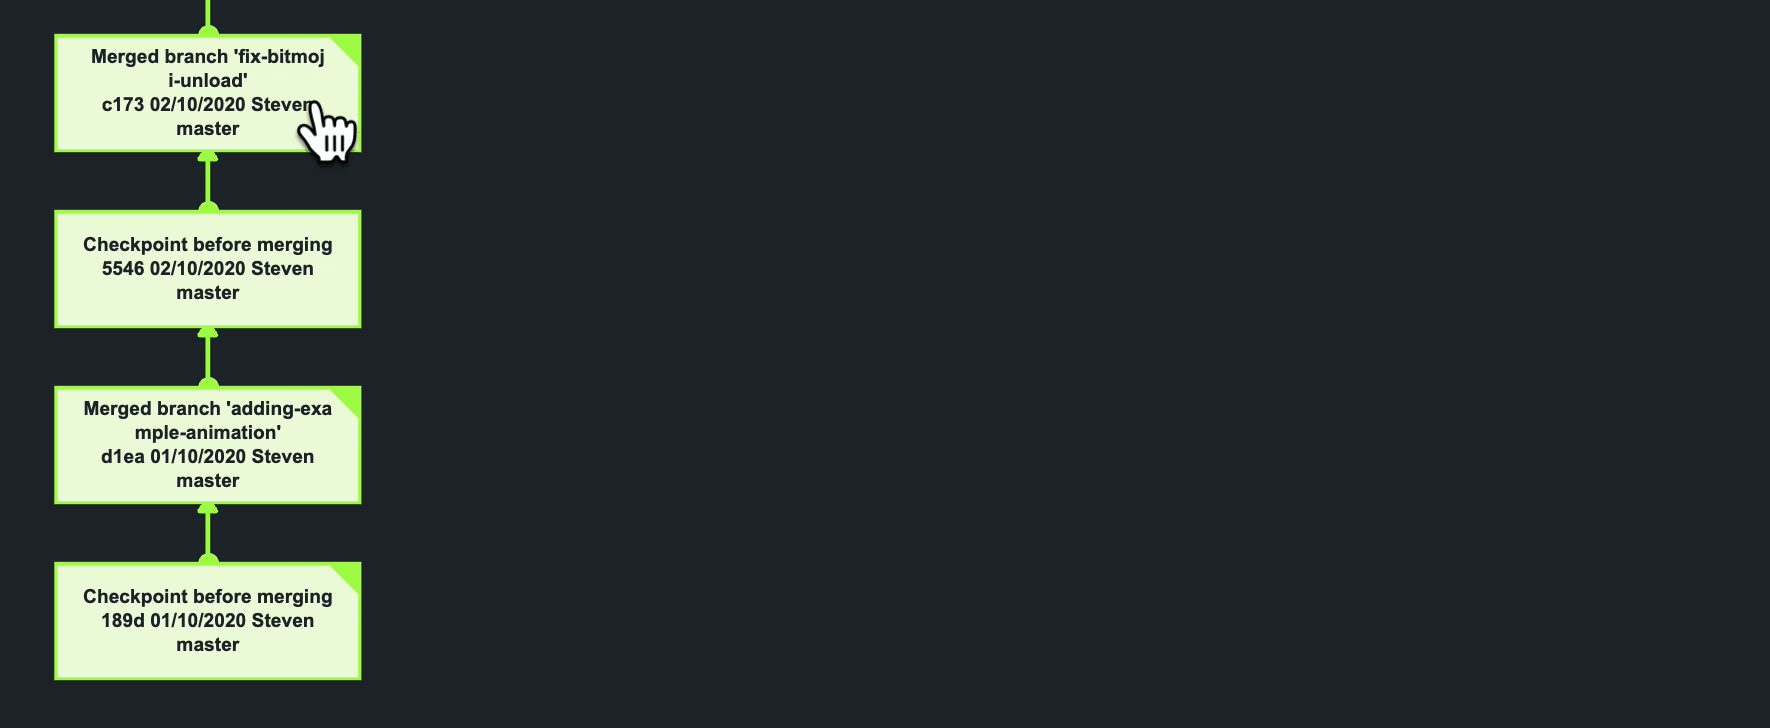
Expandable Nodes
Initially the Graph View displays up to 20 checkpoints from each branch, and up to 60 checkpoints total.
A triangle in the top right corner of a node means that it has yet more incoming or outgoing edges (such as branches and merges), and can be expanded via the 'Expand Node' context menu entry.
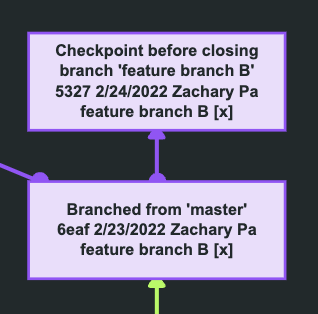
Closed Branches
The graph will also include checkpoints from closed branches so that they are able to always show both parents of a merge result checkpoint. They are marked with [x] after the branch name:
Graph Node Layout Logic
To reduce the the size of graph layout both vertically and horizontally and make it easier to navigate, the graph nodes are laid out in a specific way.
The branch that was selected when a Graph View button was clicked is shown on the left. All other branches are positioned to the right of it.
In general, each branch occupies its own column, but when possible, the graph places branches above one another, to prevent the graph nodes from being placed too far horizontally.
It also attempts to position parent checkpoints lower than their children, whenever possible.
At the same time it is trying to avoid large gaps between nodes in the branch originally selected for the Graph View, because it is more likely to need clear overview of all its checkpoints. This and similar considerations may sometimes lead to a parent checkpoint being shown higher than its child in another branch and an arrow pointing downwards.
The color of an edge helps to easily identify its direction, because it always matches the color of the source node.
The color of each branch remains the same whenever you open the Graph View and does not depend on which branch was selected to launch it.
The Graph View supports zooming in and out with the scroll wheel and panning via click and drag.