Debugging
In order to create scripts for PlayCanvas, it is vital that you know how to access and use your browser's development tools.
Chrome, Firefox and other browsers have Developer Tools integrated directly into the browser. You can usually access them by pressing F12 on Windows or ALT-CMD-I on Mac. Or use menu of a browser to access developer tools.
Debugging Scripts
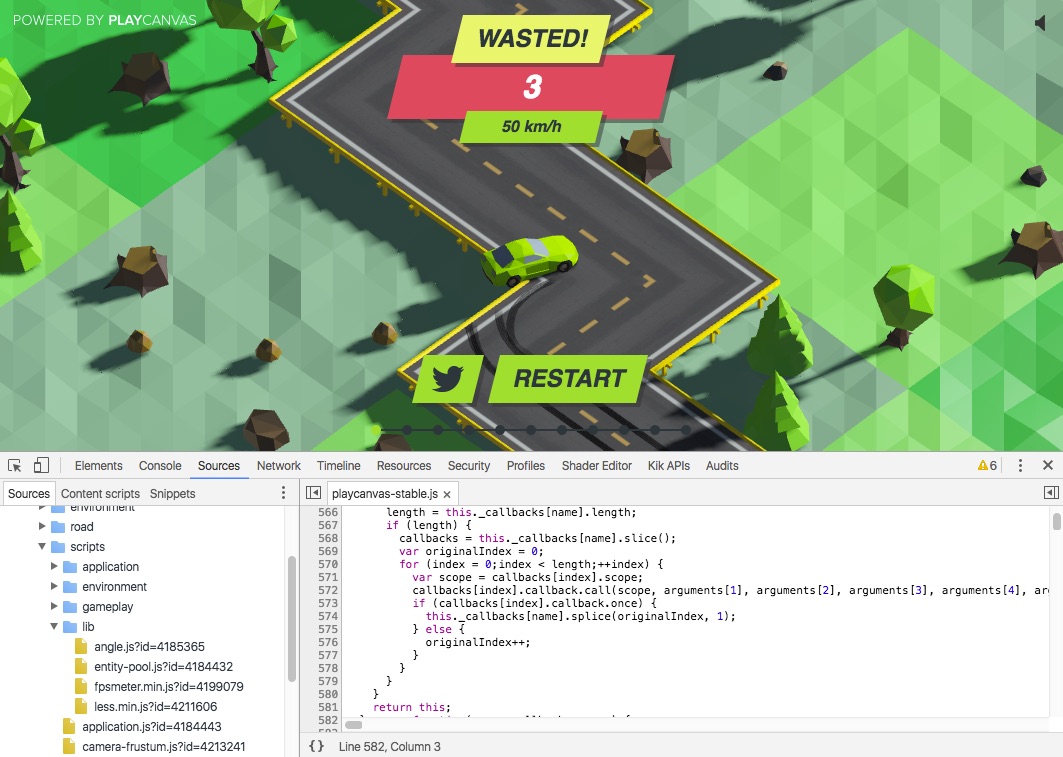
In order to debug your scripts, select the Sources tab in Developer Tools (Chrome). Open the 'navigator' by clicking the icon in the top left corner of the Sources pane. You should see something similar to what is shown below:
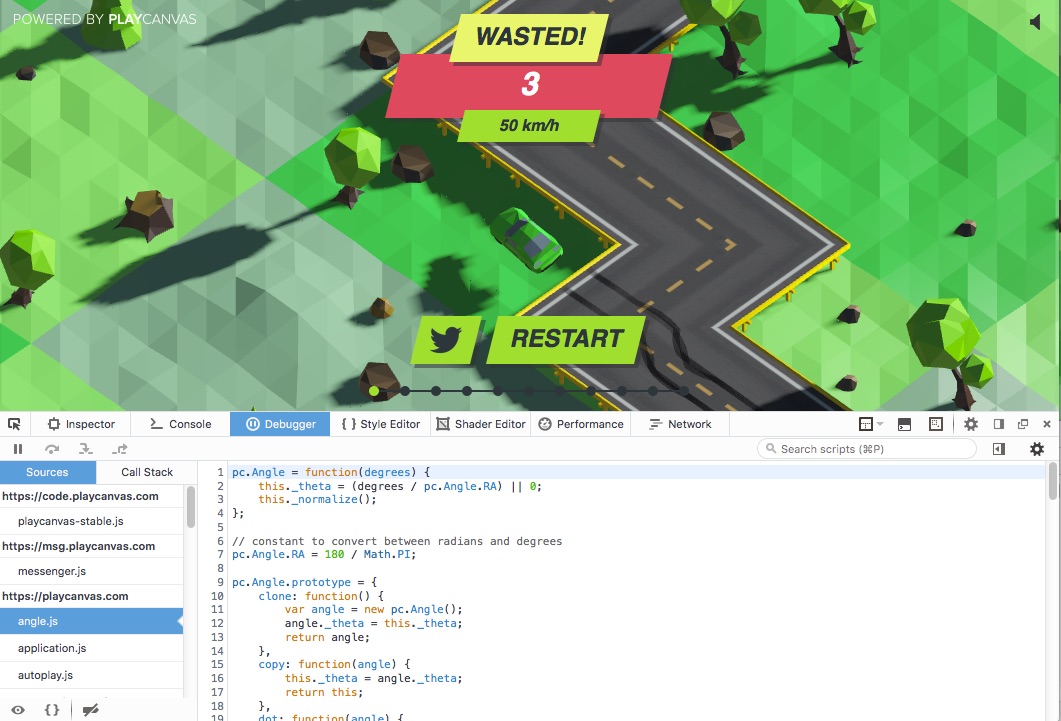
In Firefox it looks like this:
The navigator lists all of the scripts currently running in the active tab, including any PlayCanvas scripts that you have written. Find one of your scripts in the navigator and select it to open the source code. You are now able to set breakpoints and debug.
Each browser has detailed instructions on how to debug javascript. You should read through these documents: Chrome, Firefox, Safari, Edge / Internet Explorer.
Debugging on Mobile Devices
On Android, it is possible to connect to the mobile Chrome browser via the desktop Chrome browser devtools and USB cable. Google Developer documentation has the detailed steps for the setup.
iOS debugging requires access to a Mac and Apple has outlined the steps needed to enable developer options to start debugging.
In the situation where either it's not possible to connect to the web view directly from Chrome or Safari (e.g. a web view in another app) or don't have access to a Mac, the following libraries and services can help and are simple to add to projects:
- RemoteJS - Allows developers to view the console output remotely in a desktop browser and also execute JS in the console which makes it very powerful. The console output can be delayed or slow though.
- vConsole or Eruda - Adds a widget DOM object to the page that can be expanded to show console output, network requests, the page elements and more.